matplotlib.axes.Axes.margins#
- Axes.margins(*margins, x=None, y=None, tight=True)[source]#
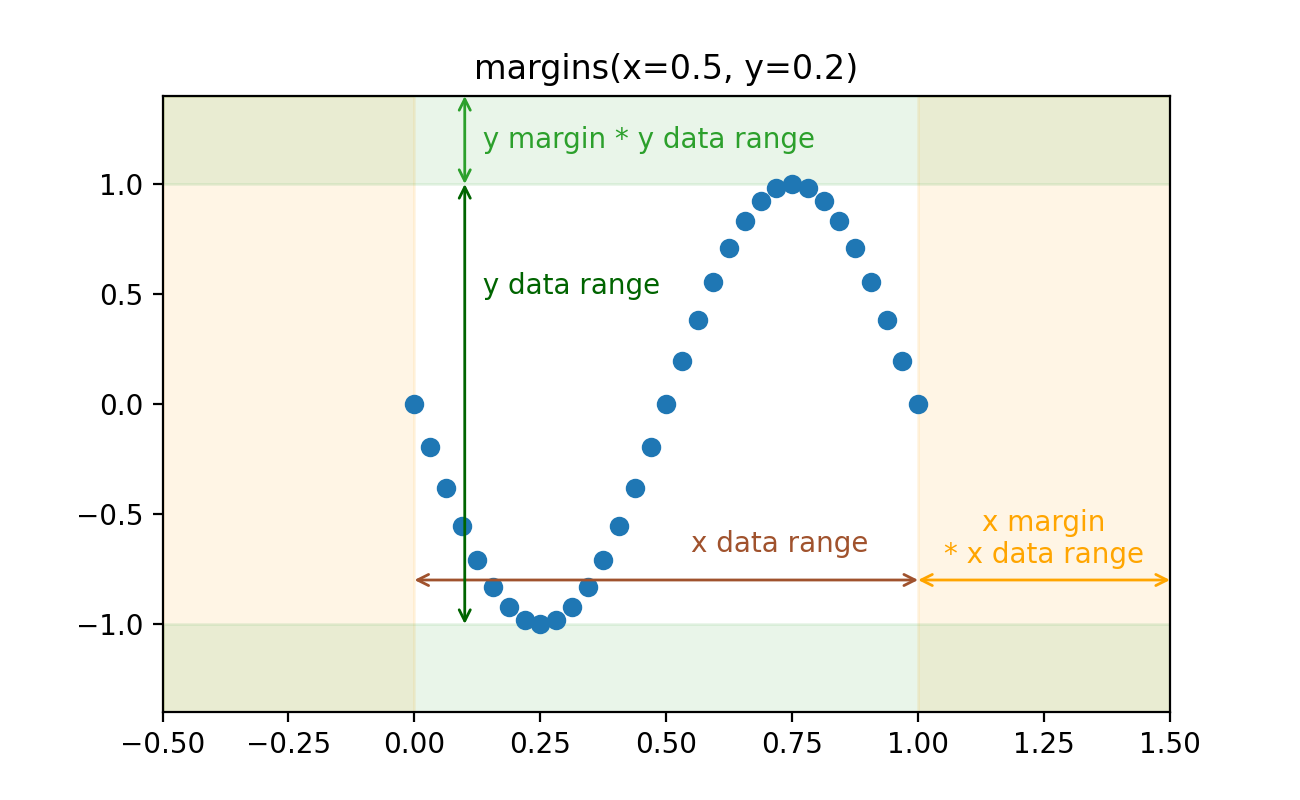
Set or retrieve margins around the data for autoscaling axis limits.
This allows to configure the padding around the data without having to set explicit limits using
set_xlim/set_ylim.Autoscaling determines the axis limits by adding margin times the data interval as padding around the data. See the following illustration:
(
Source code,2x.png,png)
All input parameters must be floats greater than -0.5. Passing both positional and keyword arguments is invalid and will raise a TypeError. If no arguments (positional or otherwise) are provided, the current margins will remain unchanged and simply be returned.
The default margins are
rcParams["axes.xmargin"](default:0.05) andrcParams["axes.ymargin"](default:0.05).- Parameters:
- *marginsfloat, optional
If a single positional argument is provided, it specifies both margins of the x-axis and y-axis limits. If two positional arguments are provided, they will be interpreted as xmargin, ymargin. If setting the margin on a single axis is desired, use the keyword arguments described below.
- x, yfloat, optional
Specific margin values for the x-axis and y-axis, respectively. These cannot be used with positional arguments, but can be used individually to alter on e.g., only the y-axis.
- tightbool or None, default: True
The tight parameter is passed to
autoscale_view, which is executed after a margin is changed; the default here is True, on the assumption that when margins are specified, no additional padding to match tick marks is usually desired. Setting tight to None preserves the previous setting.
- Returns:
- xmargin, ymarginfloat
See also
Notes
If a previously used Axes method such as
pcolor()has setuse_sticky_edgestoTrue, only the limits not set by the "sticky artists" will be modified. To force all margins to be set, setuse_sticky_edgestoFalsebefore callingmargins().
Examples using matplotlib.axes.Axes.margins#
Controlling view limits using margins and sticky_edges