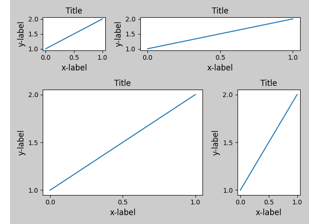
matplotlib.figure.Figure.tight_layout#
- Figure.tight_layout(*, pad=1.08, h_pad=None, w_pad=None, rect=None)[source]#
Adjust the padding between and around subplots.
To exclude an artist on the Axes from the bounding box calculation that determines the subplot parameters (i.e. legend, or annotation), set
a.set_in_layout(False)for that artist.- Parameters:
- padfloat, default: 1.08
Padding between the figure edge and the edges of subplots, as a fraction of the font size.
- h_pad, w_padfloat, default: pad
Padding (height/width) between edges of adjacent subplots, as a fraction of the font size.
- recttuple (left, bottom, right, top), default: (0, 0, 1, 1)
A rectangle in normalized figure coordinates into which the whole subplots area (including labels) will fit.
Examples using matplotlib.figure.Figure.tight_layout#

Demo of the histogram function's different histtype settings
Demo of the histogram function's different histtype settings
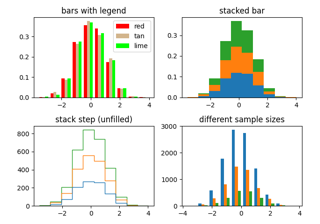
The histogram (hist) function with multiple data sets
The histogram (hist) function with multiple data sets