Note
Go to the end to download the full example code.
Infinite lines#
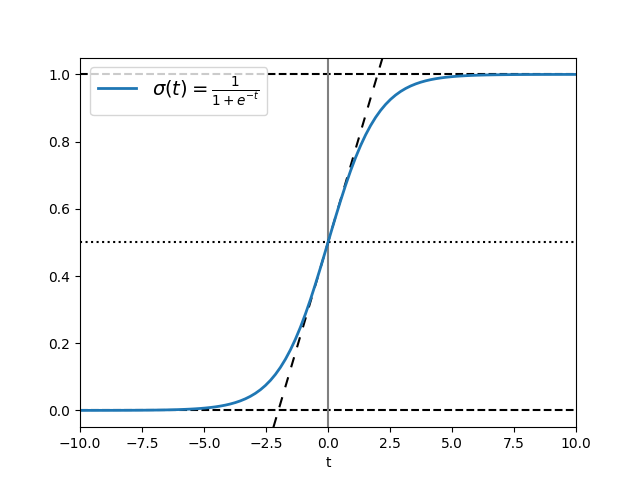
axvline and axhline draw infinite vertical /
horizontal lines, at given x / y positions. They are usually used to mark
special data values, e.g. in this example the center and limit values of the
sigmoid function.
axline draws infinite straight lines in arbitrary directions.
import matplotlib.pyplot as plt
import numpy as np

t = np.linspace(-10, 10, 100)
sig = 1 / (1 + np.exp(-t))

fig, ax = plt.subplots()
ax.axhline(y=0, color="black", linestyle="--")
ax.axhline(y=0.5, color="black", linestyle=":")
ax.axhline(y=1.0, color="black", linestyle="--")
ax.axvline(color="grey")
ax.axline((0, 0.5), slope=0.25, color="black", linestyle=(0, (5, 5)))
ax.plot(t, sig, linewidth=2, label=r"$\sigma(t) = \frac{1}{1 + e^{-t}}$")
ax.set(xlim=(-10, 10), xlabel="t")
ax.legend(fontsize=14)
plt.show()
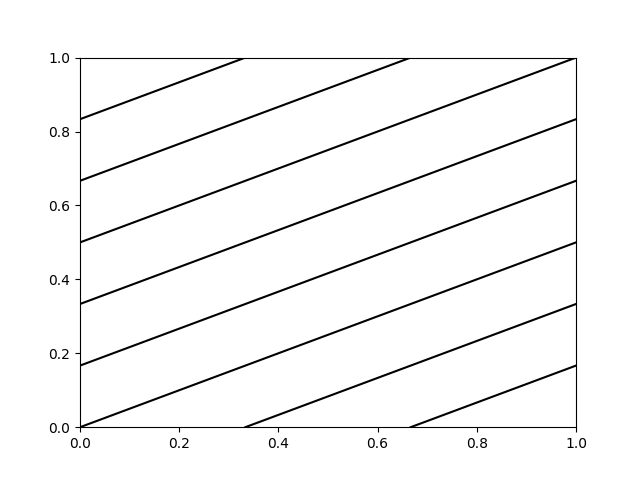
axline can also be used with a transform parameter, which
applies to the point, but not to the slope. This can be useful for drawing
diagonal grid lines with a fixed slope, which stay in place when the
plot limits are moved.
fig, ax = plt.subplots()
for pos in np.linspace(-2, 1, 10):
    ax.axline((pos, 0), slope=0.5, color='k', transform=ax.transAxes)

ax.set(xlim=(0, 1), ylim=(0, 1))
plt.show()
References
The use of the following functions, methods, classes and modules is shown in this example:
See also
axhspan, axvspan draw rectangles that span the Axes in one
direction and are bounded in the other direction.
Total running time of the script: (0 minutes 1.701 seconds)