Note
Go to the end to download the full example code.
Multicursor#
Showing a cursor on multiple plots simultaneously.
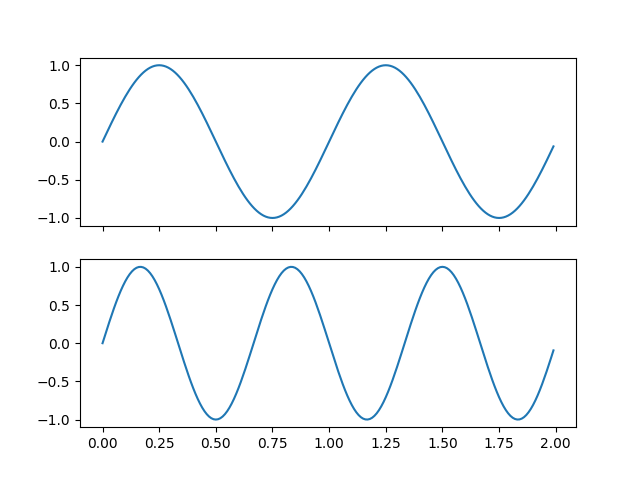
This example generates three Axes split over two different figures. On hovering the cursor over data in one subplot, the values of that datapoint are shown in all Axes.
import matplotlib.pyplot as plt
import numpy as np
from matplotlib.widgets import MultiCursor
t = np.arange(0.0, 2.0, 0.01)
s1 = np.sin(2*np.pi*t)
s2 = np.sin(3*np.pi*t)
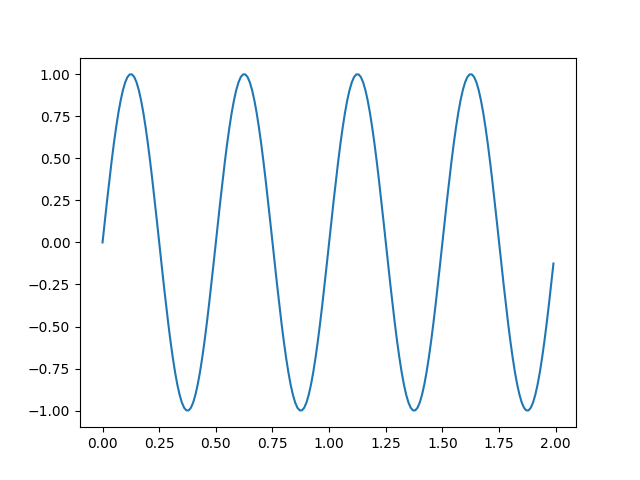
s3 = np.sin(4*np.pi*t)
fig, (ax1, ax2) = plt.subplots(2, sharex=True)
ax1.plot(t, s1)
ax2.plot(t, s2)
fig, ax3 = plt.subplots()
ax3.plot(t, s3)
multi = MultiCursor(None, (ax1, ax2, ax3), color='r', lw=1)
plt.show()
References
The use of the following functions, methods, classes and modules is shown in this example:
Total running time of the script: (0 minutes 1.245 seconds)