Note
Go to the end to download the full example code.
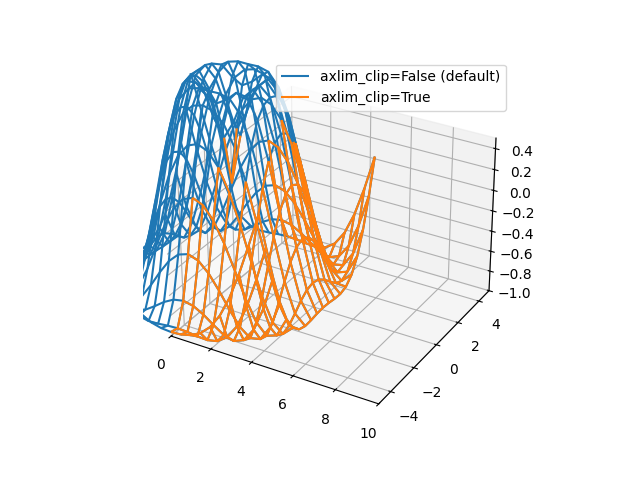
Clip the data to the axes view limits#
Demonstrate clipping of line and marker data to the axes view limits. The
axlim_clip keyword argument can be used in any of the 3D plotting
functions.
import matplotlib.pyplot as plt
import numpy as np

fig, ax = plt.subplots(subplot_kw={"projection": "3d"})

# Make the data
x = np.arange(-5, 5, 0.5)
y = np.arange(-5, 5, 0.5)
X, Y = np.meshgrid(x, y)
R = np.sqrt(X**2 + Y**2)
Z = np.sin(R)

# Default behavior is axlim_clip=False
ax.plot_wireframe(X, Y, Z, color='C0')

# When axlim_clip=True, note that when a line segment has one vertex outside
# the view limits, the entire line is hidden. The same is true for 3D patches
# if one of their vertices is outside the limits (not shown).
ax.plot_wireframe(X, Y, Z, color='C1', axlim_clip=True)

# In this example, data where x < 0 or z > 0.5 is clipped
ax.set(xlim=(0, 10), ylim=(-5, 5), zlim=(-1, 0.5))
ax.legend(['axlim_clip=False (default)', 'axlim_clip=True'])

plt.show()
Total running time of the script: (0 minutes 1.135 seconds)