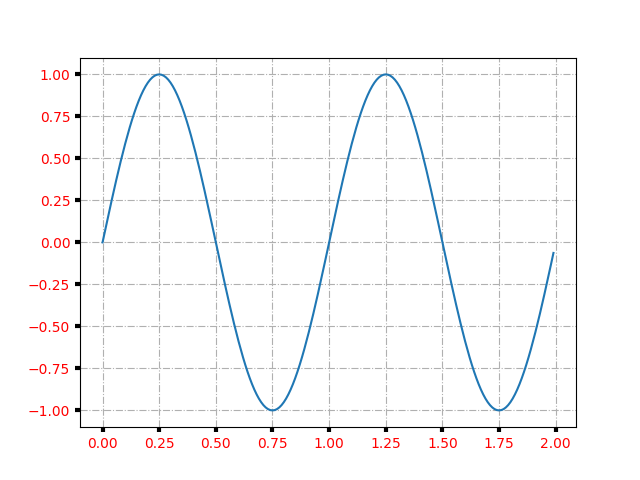
Note Go to the end to download the full example code. Axes properties# You can control the axis tick and grid properties import matplotlib.pyplot as plt import numpy as np t = np.arange(0.0, 2.0, 0.01) s = np.sin(2 * np.pi * t) fig, ax = plt.subplots() ax.plot(t, s) ax.grid(True, linestyle='-.') ax.tick_params(labelcolor='r', labelsize='medium', width=3) plt.show() Tags: component: ticks plot-type: line level: beginner Gallery generated by Sphinx-Gallery