Note
Go to the end to download the full example code.
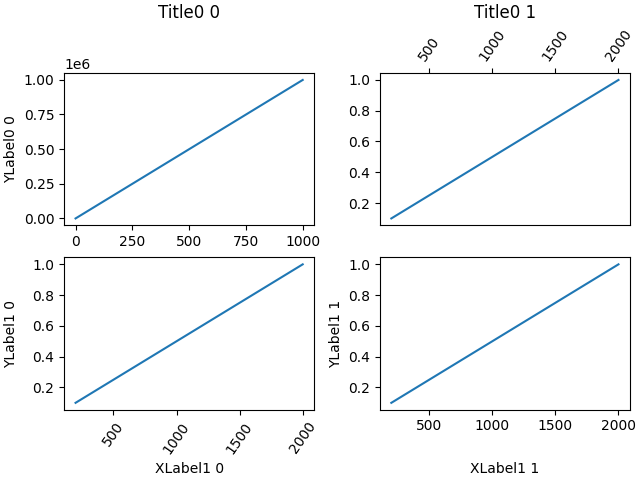
Align labels and titles#
Aligning xlabel, ylabel, and title using Figure.align_xlabels,
Figure.align_ylabels, and Figure.align_titles.
Figure.align_labels wraps the x and y label functions.
Note that the xlabel "XLabel1 1" would normally be much closer to the x-axis, "YLabel0 0" would be much closer to the y-axis, and title "Title0 0" would be much closer to the top of their respective axes.
import matplotlib.pyplot as plt
import numpy as np

fig, axs = plt.subplots(2, 2, layout='constrained')

ax = axs[0][0]
ax.plot(np.arange(0, 1e6, 1000))
ax.set_title('Title0 0')
ax.set_ylabel('YLabel0 0')

ax = axs[0][1]
ax.plot(np.arange(1., 0., -0.1) * 2000., np.arange(1., 0., -0.1))
ax.set_title('Title0 1')
ax.xaxis.tick_top()
ax.tick_params(axis='x', rotation=55)


for i in range(2):
    ax = axs[1][i]
    ax.plot(np.arange(1., 0., -0.1) * 2000., np.arange(1., 0., -0.1))
    ax.set_ylabel('YLabel1 %d' % i)
    ax.set_xlabel('XLabel1 %d' % i)
    if i == 0:
        ax.tick_params(axis='x', rotation=55)

fig.align_labels()  # same as fig.align_xlabels(); fig.align_ylabels()
fig.align_titles()

plt.show()
Total running time of the script: (0 minutes 2.185 seconds)