Note
Go to the end to download the full example code.
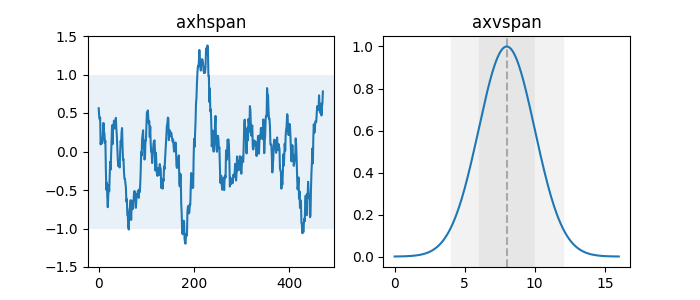
Draw regions that span an Axes#
axhspan and axvspan draw rectangles that span the Axes in either
the horizontal or vertical direction and are bounded in the other direction. They are
often used to highlight data regions.
import matplotlib.pyplot as plt
import numpy as np

fig, (ax1, ax2) = plt.subplots(1, 2, figsize=(7, 3))

np.random.seed(19680801)
s = 2.9 * np.convolve(np.random.randn(500), np.ones(30) / 30, mode='valid')
ax1.plot(s)
ax1.axhspan(-1, 1, alpha=0.1)
ax1.set(ylim=(-1.5, 1.5), title="axhspan")


mu = 8
sigma = 2
x = np.linspace(0, 16, 401)
y = np.exp(-((x-mu)**2)/(2*sigma**2))
ax2.axvspan(mu-2*sigma, mu-sigma, color='0.95')
ax2.axvspan(mu-sigma, mu+sigma, color='0.9')
ax2.axvspan(mu+sigma, mu+2*sigma, color='0.95')
ax2.axvline(mu, color='darkgrey', linestyle='--')
ax2.plot(x, y)
ax2.set(title="axvspan")

plt.show()
References
The use of the following functions, methods, classes and modules is shown in this example: