Note
Go to the end to download the full example code.
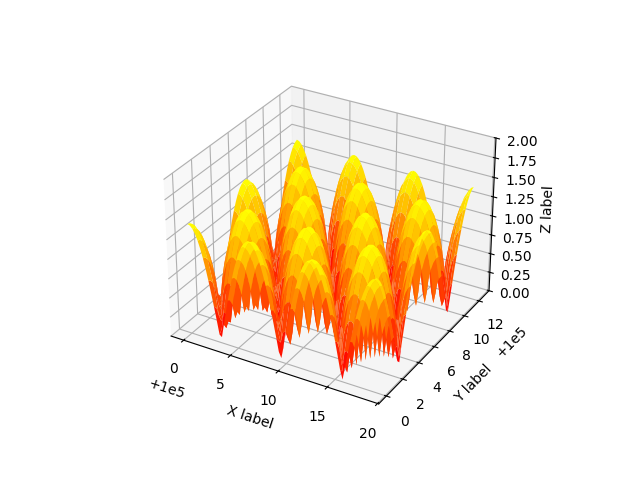
Automatic text offsetting#
This example demonstrates mplot3d's offset text display. As one rotates the 3D figure, the offsets should remain oriented the same way as the axis label, and should also be located "away" from the center of the plot.
This demo triggers the display of the offset text for the x- and y-axis by adding 1e5 to X and Y. Anything less would not automatically trigger it.
import matplotlib.pyplot as plt
import numpy as np

ax = plt.figure().add_subplot(projection='3d')

X, Y = np.mgrid[0:6*np.pi:0.25, 0:4*np.pi:0.25]
Z = np.sqrt(np.abs(np.cos(X) + np.cos(Y)))

ax.plot_surface(X + 1e5, Y + 1e5, Z, cmap='autumn', cstride=2, rstride=2)

ax.set_xlabel("X label")
ax.set_ylabel("Y label")
ax.set_zlabel("Z label")
ax.set_zlim(0, 2)

plt.show()
Total running time of the script: (0 minutes 1.473 seconds)