Note
Go to the end to download the full example code.
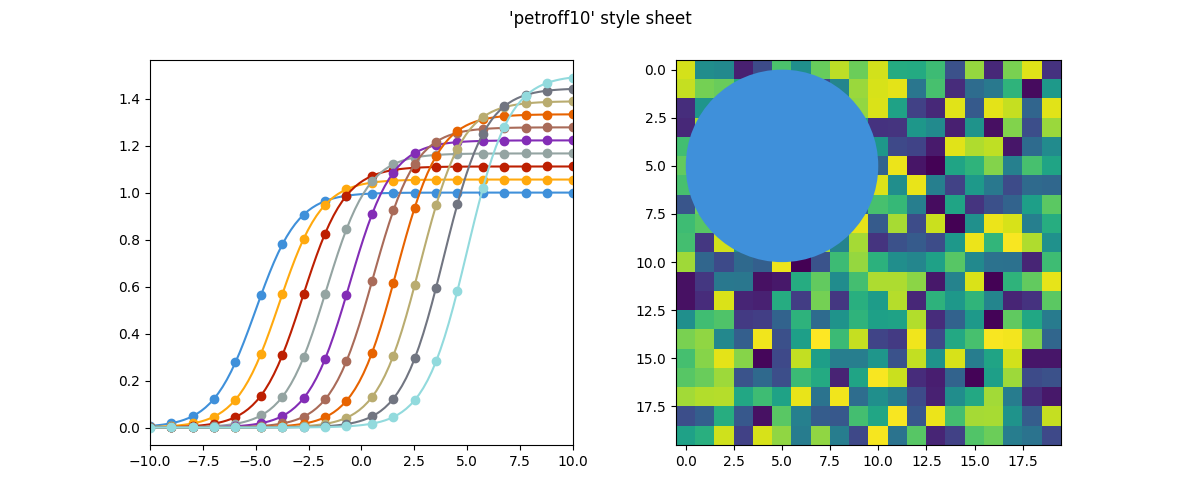
Petroff10 style sheet#
This example demonstrates the "petroff10" style, which implements the 10-color sequence developed by Matthew A. Petroff [1] for accessible data visualization. The style balances aesthetics with accessibility considerations, making it suitable for various types of plots while ensuring readability and distinction between data series.
import matplotlib.pyplot as plt
import numpy as np


def colored_lines_example(ax):
    t = np.linspace(-10, 10, 100)
    nb_colors = len(plt.rcParams['axes.prop_cycle'])
    shifts = np.linspace(-5, 5, nb_colors)
    amplitudes = np.linspace(1, 1.5, nb_colors)
    for t0, a in zip(shifts, amplitudes):
        y = a / (1 + np.exp(-(t - t0)))
        line, = ax.plot(t, y, '-')
        point_indices = np.linspace(0, len(t) - 1, 20, dtype=int)
        ax.plot(t[point_indices], y[point_indices], 'o', color=line.get_color())
    ax.set_xlim(-10, 10)


def image_and_patch_example(ax):
    ax.imshow(np.random.random(size=(20, 20)), interpolation='none')
    c = plt.Circle((5, 5), radius=5, label='patch')
    ax.add_patch(c)

plt.style.use('petroff10')
fig, (ax1, ax2) = plt.subplots(ncols=2, figsize=(12, 5))
fig.suptitle("'petroff10' style sheet")
colored_lines_example(ax1)
image_and_patch_example(ax2)
plt.show()