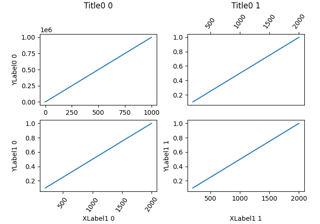
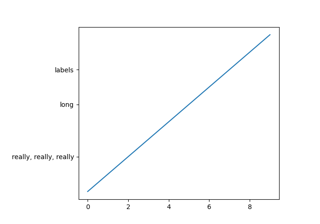
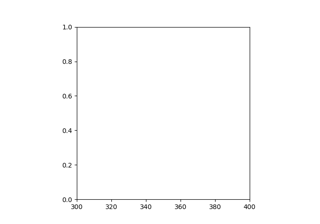
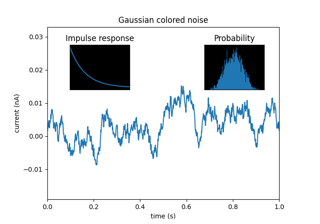
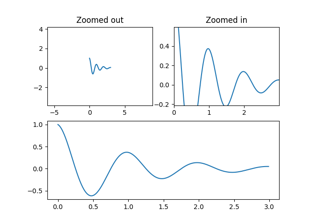
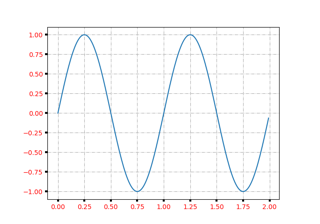
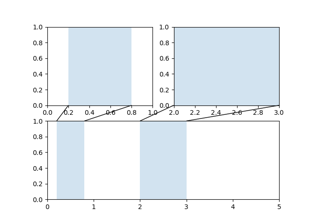
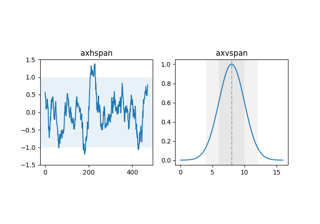
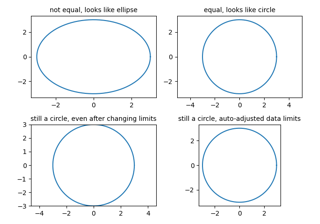
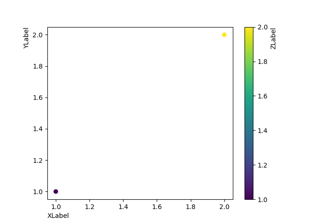
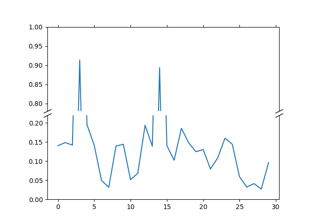
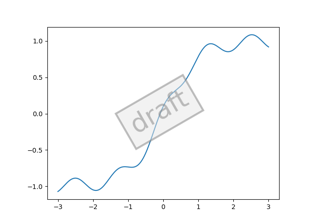
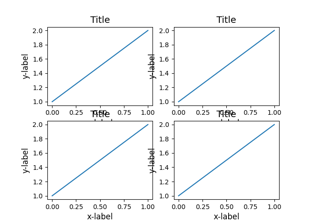
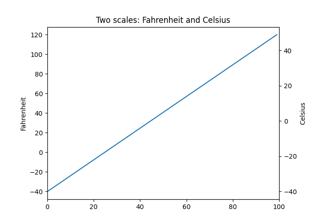
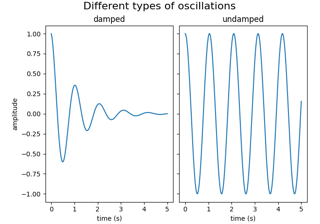
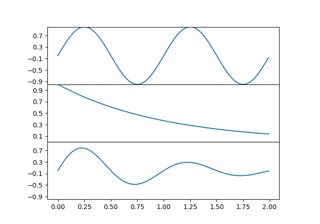
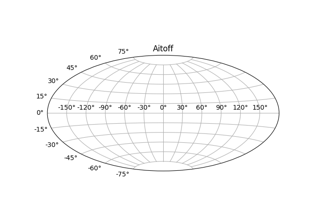
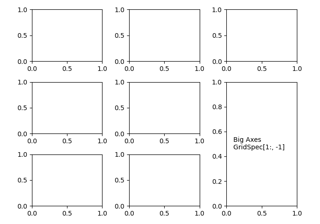
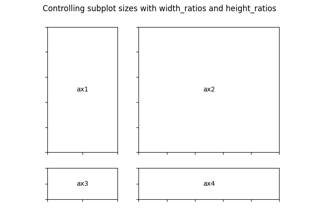
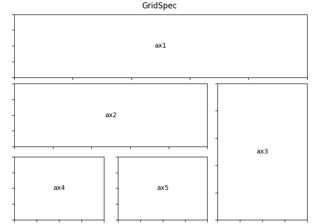
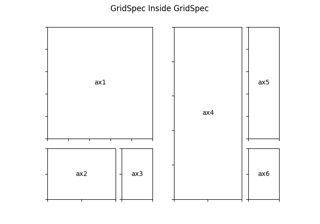
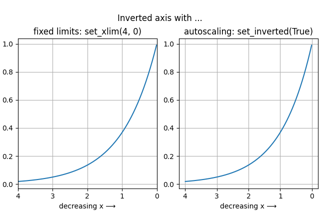
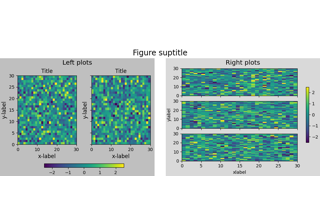
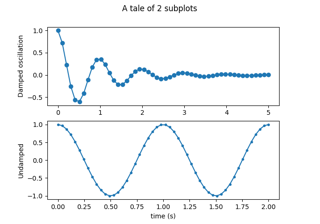
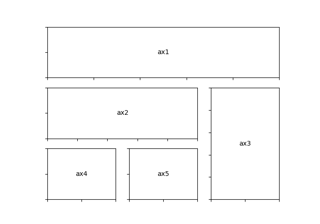
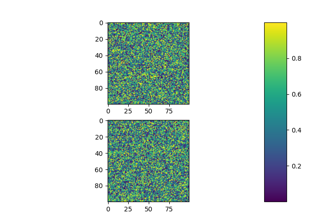
Subplots, axes and figures# Align labels and titles Align labels and titles Programmatically control subplot adjustment Programmatically control subplot adjustment Axes box aspect Axes box aspect Axes Demo Axes Demo Controlling view limits using margins and sticky_edges Controlling view limits using margins and sticky_edges Axes properties Axes properties Axes zoom effect Axes zoom effect Draw regions that span an Axes Draw regions that span an Axes Equal axis aspect ratio Equal axis aspect ratio Axis label position Axis label position Broken axis Broken axis Custom Figure subclasses Custom Figure subclasses Resize Axes with constrained layout Resize Axes with constrained layout Resize Axes with tight layout Resize Axes with tight layout Different scales on the same Axes Different scales on the same Axes Figure size in different units Figure size in different units Figure labels: suptitle, supxlabel, supylabel Figure labels: suptitle, supxlabel, supylabel Adjacent subplots Adjacent subplots Geographic Projections Geographic Projections Combine two subplots using subplots and GridSpec Combine two subplots using subplots and GridSpec GridSpec with variable sizes and spacing GridSpec with variable sizes and spacing Gridspec for multi-column/row subplot layouts Gridspec for multi-column/row subplot layouts Nested Gridspecs Nested Gridspecs Inverted axis Inverted axis Manage multiple figures in pyplot Manage multiple figures in pyplot Secondary Axis Secondary Axis Share axis limits and views Share axis limits and views Shared axis Shared axis Figure subfigures Figure subfigures Multiple subplots Multiple subplots subplot2grid subplot2grid Subplots spacings and margins Subplots spacings and margins Create multiple subplots using plt.subplots Create multiple subplots using plt.subplots Plots with different scales Plots with different scales Zoom region inset Axes Zoom region inset Axes